Measurement through the funnel

A Marketer’s Guide to Major Measurement Methods and Triangulation/ Unified Measurement
A general exploration of key measurement methods, what they’re used for, and how insight and effectiveness teams use various data and techniques to build the effectiveness narrative in the privacy age.
Key Measurement Requirements


forecasting and strategic direction

-
Brand awareness and perception
-
Budget planning, performance
forecasting and strategic direction -
Granular, tactical and reactive decisions
-
Continuous innovation and improvement
Upper-Mid Funnel
Brand awareness and perception
Continuous brand tracking
Surveys, panels, focus groups, social listening, network analysis, sentiment analysis, etc.
Brand tracking helps us to understand where our brand sits against KPIs, though it doesn’t influence it.
Sometimes these methods are used as ‘one-off’s, though for larger brands, they are often ‘always on’. Similarly, they can vary between qualitative data (e.g. information gathered in conversational form from focus groups) and quantitative data (e.g. from ongoing survey responses).
Primary KPIs:
Awareness (prompted/unprompted), consideration, ad awareness (prompted/unprompted), penetration, purchase intent, brand desire, top of mind.
Time to Insight:
Can be continuous or snapshot. Depending on cadence, (e.g. quarterly), may need to build history for two or more years. Insight is then delivered in weeks.
Typical data sources:
Includes Kantar, YouGov, Ipsos, etc.
Measures how the brand is perceived, including desirability, and gauges performance against competitors.
Adds richness and emotional intelligence to your brand story.
Often limited in relationship to outcomes (e.g. sales) from brand tracking alone. Though can be nested in Marketing Mix Modelling (MMM) – see later – to provide the link.
Can place too much emphasis on emotions that are not linked to behaviours; what people say they think is not necessarily a driver of what they do.
Can be limited in statistical validity (sample bias/size for one ‘one off’ or small studies).
Lower Funnel
Granular, tactical and reactive campaign decisions

Attribution
Last-click, multi-touch (MTA), first-click (rarely)
A prescriptive method that helps with campaign optimizations. Attribution, as we know it today, became popular in the 2010s in digital advertising due to the opportunity to ‘follow’ individuals around the web using cookies. This made it possible to understand the user journey and link paid digital activities, whether search or social (pay per click/PPC/biddable media), to sales. Last-click remains the most popular method, with ‘multi-touch’ (MTA) considered more refined as it assigns a weighting to measurable touch points along the journey.
Primary KPIs:
Conversion metrics, such as a click, website visit or add to cart. Performance KPIs (outcomes that can improve through optimization) include CPC (cost per click), CPV (cost per view), CTR (click-through rate), CVR (conversion rate) , ROAS (Return on Ad Spend), Impressions, Downloads (e.g. for apps), Sales.
Time to Insight:
While insights are often available within the first day, it typically takes time for campaigns and automated optimizations to stabilize. Ideally 90+ days for history (but no shorter than one week within a campaign) and insights within weeks.
Typical data sources:
Typically large platform providers such as Google Ads, Google Display Network (GDN), Meta, etc.
Granular data persists, despite cookie deprecation/ IDFA loss, though not to the extent it once did.
Rapid feedback allows for intra-campaign optimizations.
MTA attempts to understand the interaction along the path to purchase in a digital environment.
Typically limited in channel scope (mainly digital) – i.e. partial channel picture and mis-attribution potential.
Limited understanding of incremental relationship to outcomes (e.g. sales); some activity may be in the path rather impacting the path.
Measures of ROI used in attribution may not match broader measures given they relate only to a specific channel/campaign.
Mid-Lower Funnel
Continuous innovation and improvement

Experiments
Consumer- or geo-based tests
Experimentation aims to support taking calculated risks on smaller populations to statistically determine whether a particular lever (e.g. targeting or creative) has a genuine causal impact on an outcome, e.g. sales or enquiry. This is done by comparing response behaviours between a test group, and a control group. Groups could be, for example, customer segments, a set of stores, or regions. The test must be set up properly to ensure the results are statistically valid and learnings can be relied upon when it comes to rolling out ‘winning strategies’.
Primary KPIs:
Sales, CTR (click-through-rate), open-rates, etc.
Time to Insight:
Insights in weeks, data history required is for the duration of the test (plus previous activity).
Typical data sources:
Includes sales or other outcome data, the metric of interest (e.g. media spend, store installation etc.). Sometimes combined with broader MMM sources to contextualize and enrich robustness.
Experiments can be an entry point to building a measurement capability – more focused/less data intensive on a few specific levers.
Can augment Marketing Mix Modelling (MMM) by filling measurement gaps & pushing the boundaries of MMO optimization potential, resulting in bolder decisions and more agility.
Helps to focus on learning and innovation and measure new levers; can be a good way to help find new audiences, develop localized tactics or support major shifts in spend with a low-cost approach to a test and learn culture.
By nature, experiments are hyper-focused and will only provide incrementality for a specific lever/strategy.
The measured lever needs to be executed such that it is possible to measure incrementality through testing (Note: MMM can measure any past lever).
While often mitigated, in some fields, it can be difficult to maintain perfect control that is free from contamination due to various external factors.
Whole Funnel
Budget planning, performance forecasting, strategic direction

Marketing Mix Modelling
Econometrics, econometric modelling
Marketing Mix Modelling (MMM) captures the full range of business drivers, including external factors, to tell the whole story across all marketing activities and the role each plays in delivering an outcome. It measures interactions between channels and the relationship between an outcome (e.g. sales) and influencing factors (both marketing and external, e.g. economic pressures) to understand ‘incrementality’ (outcomes that would otherwise not have occurred) over the long term. That means it can fill the gaps left by methodologies such as attribution.
Primary KPIs:
Sales, revenue, profit, ROI, brand, traffic.
Time to Insight:
MMM can take months to deliver insight and require 2-3 years of data history.
Typical data sources:
Uses a multitude of different data sources throughout the funnel, across channels and outcome responses.
Impactful insights and an understanding of both different marketing techniques and external influences on outcomes that allow you to determing big budget decisions. Introduces common language and begins to break silos.
Modern methods – especially facilitated by AI/ML complemented by human domain knowledge/subject matter expertise, integrate with more frequent and more granular data – are overcoming previous perception that MMM is old-fashioned, infrequent, backward-looking and laborious.
MMM can be expensive to implement and can take longer to produce insights.
Poor definition of measurement requirements in campaign briefing can result in not capturing the data necessary to the desired analysis.
Whole Funnel
Strategy linked to tactics through measurement

Triangulation/ unified measurement
MMM, attribution, brand tracking, test & control
A mechanism for integrating all analysis into a singular framework to capture a whole picture. The gold standard has MMM at the heart for integration with different ‘lenses’ from other methods supplementing and enhancing the story, according to the question at hand.
Primary KPIs:
Sales, Revenue, Profit, ROI, AOV, etc – encompasses all previously discussed KPIs
Time to Insight:
Days to years, depending upon maturity
Typical data sources:
Data sources for unified measurement are many and varied and across all platforms, e.g. marketing automation systems, media providers, sales/customer systems and more.
Links strategy with tactics through a unified measurement framework; insights are holistic and have consistency of meaning, e.g. ROI means the same regardless of whether it is a measure of campaign, channel or whole budget ROI.
Shared language and meaning organization-wide.
Captures both the granularity and speed of attribution with the holistic, longer-term view of MMM.
Often described as the holy grail, it can be expensive, complex, resource intensive and lengthy to implement.
Difficult to achieve in one step, though with the right plan, value can be delivered along the way to unlock the next phase of development.
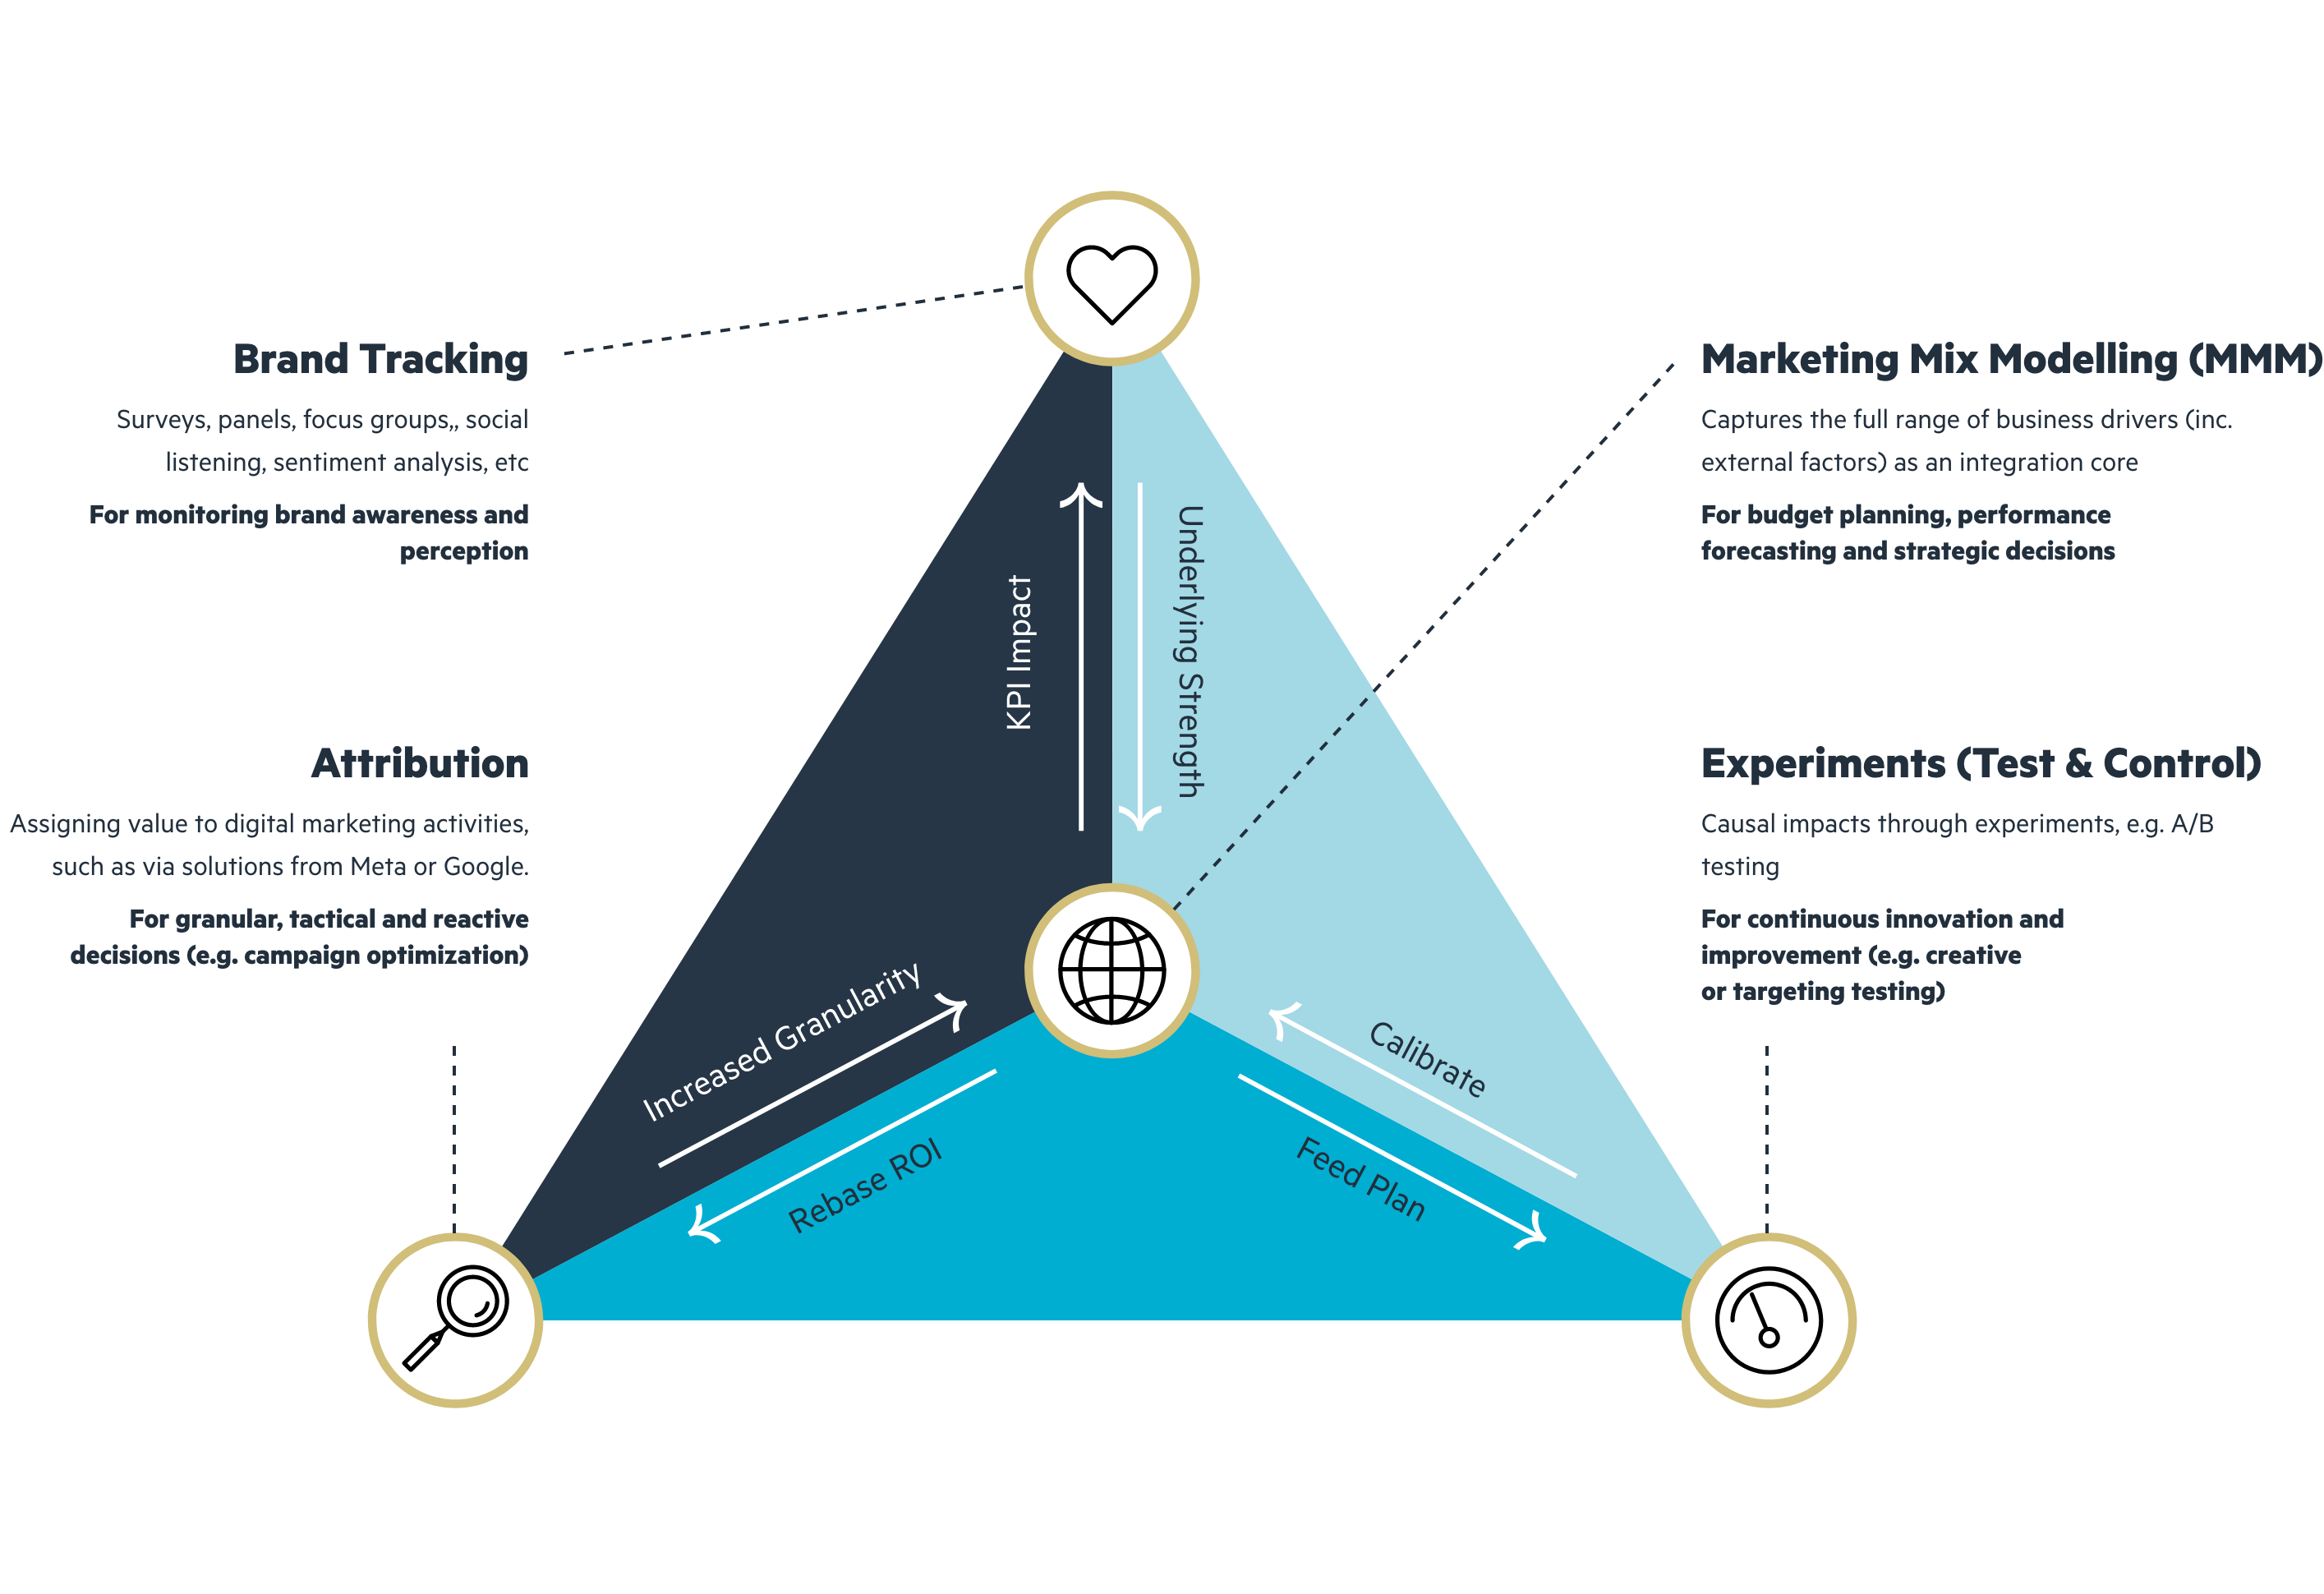
Key measurement methods & triangulation/ unification
Illustration of the major measurement solutions used together to evaluate marketing performance, with MMM at the core for integration (Methods can be used independently or together)
-
Brand Tracking
Surveys, panels, focus groups, social listening, sentiment analysis, etc
For monitoring brand awareness and perception
-
Marketing Mix Modelling (MMM)
Captures the full range of business drivers (inc. external factors) as an integration core.
For budget planning, performance forecasting and strategic decisions
-
Attribution
Assigning value to digital marketing activities, such as via solutions from Meta or Google.
For granular, tactical and reactive decisions (e.g. campaign optimization)
-
Experiments (Test & Control)
Causal impacts through experiments, e.g. A/B testing
For continuous innovation and improvement (e.g. creative or targeting testing)
Main Challenges of Measurement
Data Quality / accessibility / privacy
Missing or poor-quality data can lead to flawed analysis. Attribution (in particular) only sees a partial channel picture, made more opaque by privacy.
Proxies may be possible but require skillful handling and interpretation. MMM is becoming favoured once more.
Reveal tips Close tips
Time to insight / frequency
Methods that satisfy frequency often miss the whole picture, but lengthy timescales from execution to insight frustrate commercial implementation. The faster you can react to new insight, the faster you realise the benefit.
New approaches to MMM deliver faster, more granular insights to overcome drawbacks of attribution.
Reveal tips Close tips
Consistency of metrics
For example, ROI can mean many things. Campaign ROI, Channel ROI, Budget ROI are all different and different methods can produce different results, especially if not able to expose incrementality and impact on profit.
Choose measures that can be understood business-wide.
Reveal tips Close tips
Models are never perfect
Mathematical models have degrees of performance. Good models can predict well, but only to a certain tolerance, meaning care is needed in real-world application.
The skill is in stakeholder engagement to ensure assumptions and techniques produce the best possible results.
Reveal tips Close tips
Complexity
More data, more products, more territories means more complexity both in data engineering and modelling.
Start with key questions or use cases and build from there.
Reveal tips Close tips
Clarity
Clarity from the outset of activity of the hypothesis or questions we want to answer, and the evaluation methods is critical to ensuring we set ourselves up for success.
Ensure you brief with effectiveness in mind. Involve the I&E team early.
Reveal tips Close tips
Lost in translation
Analytics and business teams often communicate poorly. Commercially- focused measurement experts can understand the business, commission and translate analysis.
Ensuring insight is useful, usable and used depends on the culture of data in the org.
Reveal tips Close tips
Stuff happens
Competitors, consumer behaviour, politics, pandemics. All can have a significant impact, despite best endeavours. Models no longer work and need to be rebuilt.
I&E teams are becoming increasingly agile with more in their toolkit to help overcome.
Reveal tips Close tips
Measurement Maturity Curve

Building Success
Basic analytics and data exploration applications.
Not yet scalable/ compliant with IT.
Proof of Value local initiatives; low appropriation overall.
Capturing Value
Not yet covering the entire business.
Pionneer department building first platforms.
C-suite supportive. More request from the business.
Scaling Analytics
Strategized data science, with pipeline of use cases and roadmap to serve.
Centralized data/IT investments in data platform.
Centre of excellence with talent strategy, resources and commitment.
Becoming Data Driven
Data-driven decision making is the norm at C-suite and all functions.
Data is served in appropriate formats, for all needs, from exploration to operations.
Global governance dissolved silos, common performance monitoring.
Marketing Data Ecosystem
Turn decisions on and off to reveal data sources
Marketing mix optimization (strategic budget decisions for optimal ROI)
Channel optimization
Promotion optimization
Price optimization
Message optimization
Campaign optimization
Brand positioning / creative direction
Creative optimization
TV / Radio / OOH data
Sponsorship & PR
Organic search rankings / data
Sales performance (e.g. value, volume, display, commission)
Behavioural data (e.g. account operation, app interactions)
RPI / CPI / Inflation
Digital Display & Video data (e.g. Google Display Networks)
CRM / Direct Mail / SMS
Organic social and influencers
Profile / attitudinal data (e.g. demographics, preferences feedback)
Retail Sales
Seasonal / Weather / Natural disasters / pandemics
Paid Search (e.g.Google Ads)
Trade marketing / Retailer network data
Owned engagement data (e.g. web/customer servicing)
Customer purchase / usage / pricing history
Supply chain data
Employment / wages / GDP / Credit availability
Paid social and influencers
Price / promotions
Brand data
Store data (e.g. workforce, installations, etc)
Competitor activity (media spend, price positioning etc.)
Footfall data
NB this is illustrative/simplified in terms of data sources/complexity of acquiring data. Every organisation and every request of the analysis requires different data items.
Measurement Triangulation Maturity


Disparate, Simplicstic Measurement
Used by individual teams with different approaches and different requirements.
Still Disparate But With Informal Collaboration
Working together to try to make to sense of different techniques, perhaps adding MMM.
Using Different Point Solutions Together To Follow The Story
Often consolidated to a single measurement team for a given brand/territory. Attempting to create a holistic view. MMM still separate, if used.
Triangulation / Unified Measurement
With MMM used as an integration point for all analyses, with different lenses.
The path to maturity in reality
There are many paths to each state that will differ from one organisation to another.
Measurement Triangulation Maturity

Disparate, Simplicstic Measurement
Used by individual teams with different approaches and different requirements.

Still Disparate But With Informal Collaboration
Working together to try to make to sense of different techniques, perhaps adding MMM.

Using Different Point Solutions Together To Follow The Story
Often consolidated to a single measurement team for a given brand/territory. Attempting to create a holistic view. MMM still separate, if used.

Triangulation / Unified Measurement
With MMM used as an integration point for all analyses, with different lenses.
There are many paths to each state that will differ from one organisation to another.


There are many paths to each state that will differ from one organisation to another.
Glossary of Major Terms
Terms or Phrase
Description
Sales Revenue
Total income from products/ services sold.
Profit
Income minus costs
Sales
The number of units sold
AOV (Average Order Value)
A measure of the average basket size of a given customer or group of customers
ROI (Return on Investment)
ROI – the amount of money you gain compared to the cost – is measured as: ROI (monetary metric) = (incremental units of metric – investment) / investment NB ROI (any metric) = incremental units of metric / investment in the activity
Incrementality
Measures additional outcomes (e.g. sales) that wouldn’t have happened without a particular activity
LTV (Customer Lifetime Value)
A measure of the value (ideally profit) of a or group of customers over the whole time they are a customer
ROAS (Return on Ad Spend)
Typically expressed as a ratio, this specifically measures the revenue generated for every monetary unit of ad spend.
CPL (Cost per Lead)
The total marketing cost of a generating a new lead
CPA (Cost per Acquisition)
The total marketing cost of each new customer
CVR (Conversion Rate)
Measures ‘conversion’ actions – e.g. a click on a call to action, content download, basket add, sale – as a proportion of all activity (e.g. in a campaign or on a website)
Retention rate
The percentage of repeat or retained customers (e.g. defined by purchase frequencies or contract longevity) – the converse of this is ‘churn rate’
NB this is not an exhaustive list, with many other key metrics for specific activity, e.g. website traffic, cost per click, click-through rates, share of voice and many more.
About Ekimetrics
Ekimetrics is a leader in data science and AI-powered solutions. Since 2006, we’ve pioneered the use of AI and advanced data science applied to unified marketing measurement, holistic business optimization and broad-ranging sustainability goals.
Our goal
To combine high impact with long-term business purpose to redefine performance.
From data engineering to analytics, data culture to transformation, our holistic approach to marketing effectiveness has earned us significant recognition.
Including Analytics Company of the Year 2023 (British Data Awards) and being named a ‘Leader’ in the Forrester WaveTM: Marketing and Optimization Q3 2023, where we scored top for talent, with 5/5 on 16 different criteria, including Marketing Strategy Consulting and Global Client Management.

Ekimetrics combines cutting-edge tools with bold vision and innovation… providing marketers with next-generation analytics… [and] strong engineering.Forrester